Initial Design: Water Works™ (Irrigation) — Market + Timeline
Adaptive, sensor-gated filtration for drip/micro irrigation using variable-quality surface water. This page builds on our Preliminary Design Report and updates the concept for an irrigation customer (Initial Design Presentation).
1) Introduction
Despite major advances in irrigation technology, many farms still rely on surface water sources (ponds, canals, rivers, holding tanks) whose sediment load changes rapidly after storms and seasonally with runoff. For growers using drip and micro irrigation, this variability creates a reliability problem: emitters have small passages that clog quickly as turbidity rises, leading to downtime, maintenance, and uneven irrigation.
Our goal is to build an adaptive irrigation filtration system, Water Works™, that automatically circulates source water through a particulate filtration stage and an adsorbent treatment stage until sensor feedback indicates the water has reached an irrigation-relevant clarity target. Rather than filtering continuously at a fixed setting, the system operates in a semi-batch mode: it produces a batch of “irrigation-ready” water only when storage is low. This reduces unnecessary pumping and makes the adaptive behavior clear: filter only as long as needed.
Who is this for? Water Works™ targets growers and operators using drip/micro irrigation with variable source water (surface water or mixed sources), especially those experiencing frequent emitter clogging, high maintenance burden, and inconsistent irrigation reliability.
What problem does it solve? Today, turbidity swings force growers to either (i) accept clogging/downtime or (ii) install oversized, maintenance-heavy filtration sized for worst-case conditions (screen/sand/disk systems plus chemical injection). Both approaches can increase cost and energy use, even when the source water is temporarily cleaner.
Why adaptive? Turbidity is a fast-changing and measurable variable. A sensor-gated recirculation loop can run filtration only until clarity reaches a target and then stop, preventing permanent over-filtration. Our design objective is to deliver water suitable for drip/micro irrigation with an operational clarity target of < 10 NTU.
- Growers using drip/micro irrigation with variable source water (surface water or mixed sources).
- Operators who experience emitter clogging, frequent maintenance, and inconsistent irrigation reliability.
- Deliver “irrigation-ready” water by driving turbidity below a threshold (objective: < 10 NTU).
- Minimize energy by avoiding continuous filtration when not needed.
2) Overall Design (Expanded — updated for irrigation customer)
Water Works™ connects to a continuous irrigation water source (feed line from pond/canal/holding tank). It runs in a semi-batch cycle: it produces a batch of treated irrigation water when the storage level is low, rather than filtering nonstop. This keeps the system simple, reduces unnecessary pumping, and highlights the adaptive behavior: keep cycling water until the sensor indicates it is clean enough to transfer.
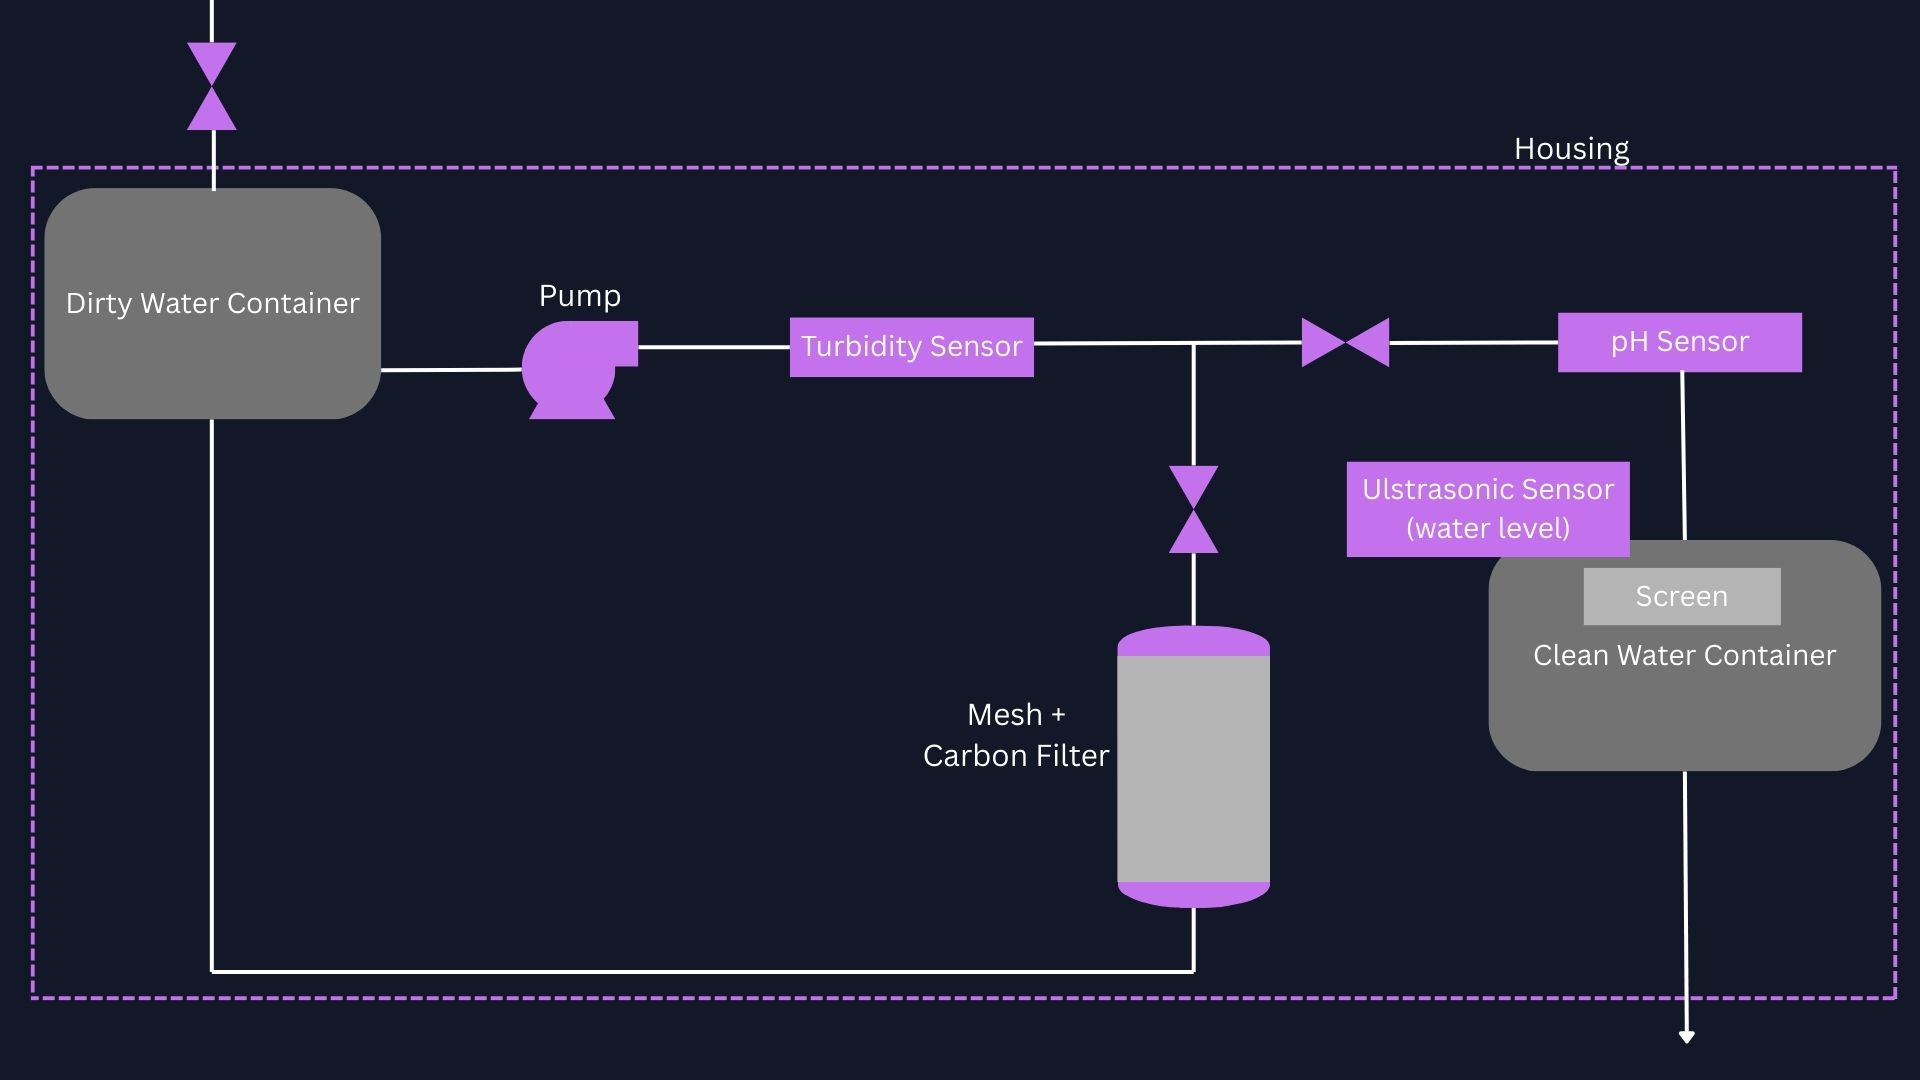
System Concept (Semi-Batch, Sensor-Gated)
- Source connection: a feed line supplies raw water when the inlet valve is opened.
- Raw batch chamber (Tank 1): filled to a set level at the start of each cycle.
- Recirculation loop: pump repeatedly drives water through sensing + filtration stages, returning to Tank 1.
- Clean storage reservoir (Tank 2): once turbidity threshold is met, water is routed to storage; pH is measured and displayed.
- User interaction: users draw from Tank 2; the system detects low/empty storage and starts the next batch automatically.
Why two tanks? Tank 1 is the controlled “process volume” we recirculate until it reaches the clarity target. Tank 2 is a decoupled storage buffer that can be larger. This keeps the control problem stable and repeatable (always treat a known batch volume in Tank 1) while still delivering useful storage capacity.
Flow Path (Detailed)
- Fill: when Tank 2 is low, open inlet valve and fill Tank 1 to a target level (ultrasonic sensor or float switch).
- Recirculate + treat: pump circulates water through (i) turbidity sensing and (ii) filtration module, then returns to Tank 1.
- Pass condition: once turbidity stays below threshold for a hold time (with hysteresis), switch from recirculation mode to transfer mode.
- Transfer: pinch valves close the recirculation return and open the path to Tank 2; treated batch is sent to storage.
- Ready state: display pH in Tank 2; system idles until Tank 2 drops below threshold and repeats.
Diagram
Filtration Module (Mesh + Activated Carbon)
- Fine mesh / filter pad: removes particulates (silt, debris, suspended solids) by size exclusion and interception, protecting emitters.
- Activated carbon bed: provides adsorption capacity for dissolved organics and odor-causing species, adding treatment margin.
- Key design considerations: flow rate affects carbon contact time; packing density and mesh tightness affect pressure drop and energy use.
Turbidity Sensing with a Phototransistor (Optical Clarity)
The adaptive decision variable is turbidity/clarity measured optically. An LED shines through an inline chamber (or clear tubing segment) and a phototransistor measures received light intensity. Cloudier water scatters/absorbs more light, reducing intensity at the detector; clearer water increases it. The microcontroller reads a repeatable signal (voltage across a resistor / divider) that correlates with transmitted light.
- Measurement approach: Arduino reads an analog voltage tied to phototransistor current (more light → more current → different voltage).
- Why sufficient here: even without absolute NTU calibration, it provides a consistent signal for “getting clearer” and “clear enough.”
- Noise mitigation: light-shielded housing, fixed geometry, and moving average/median filtering.
- Calibration plan: measure clean baseline (clear water) and dirty baseline (fine silt) → choose thresholds with hysteresis to avoid chatter.
LED + resistor → optical chamber → phototransistor sensing circuit → Arduino analog input
Control Logic (High-Level)
- Trigger: if Tank 2 is low, start a new batch.
- Fill: open inlet valve until Tank 1 reaches target level.
- Filter loop: recirculate while monitoring turbidity; continue until criteria met.
- Pass + transfer: if turbidity remains below threshold for hold time, route to Tank 2.
- Stop: stop pump when batch depleted or Tank 2 full; return to idle.
- Display: measure and display pH in Tank 2 as a diagnostic/context metric.
Future Sensor Additions (If Time Allows)
Additional sensors could improve robustness beyond turbidity alone. Examples include conductivity/TDS for dissolved ions, temperature compensation/logging, and simple flow sensing to detect clogs and estimate filter loading over time. Large irrigation systems also commonly use chemical injection, a natural extension for later prototypes.
3) Chemical / Physical Principles
Our system combines mechanical filtration and adsorbent treatment, then uses sensor feedback to decide when the water is “clean enough” to transfer into storage. For this prototype, contaminants that matter operationally fall into two categories: suspended particles (drive turbidity and clogging risk) and dissolved compounds/organics (can contribute to fouling, odor, and inconsistent behavior).
Filtration + treatment (mesh + activated carbon)
- Mesh / filter pad: removes suspended solids by size exclusion/interception; reduces turbidity and protects emitters.
- Activated carbon: adsorbs dissolved organic compounds; adds treatment margin for surface-water organics.
- Key tradeoff: tighter filtration + longer contact improves quality but increases pressure drop and cycle time.
Turbidity and optics (sensor feedback)
Turbidity measures suspended material. These particles scatter/absorb light, reducing transmission. During filtration, the turbidity signal should improve and then plateau. That monotonic trend makes turbidity practical for closed-loop control: filter until the signal stabilizes below a threshold.
- Optical principle: scatter/absorb light → lower transmission in cloudy water.
- Expected trend: transmitted light increases and plateaus as water clears.
- Noise sources: bubbles, turbulence, splashing, ambient light leakage.
- Mitigation: light-shielded housing, fixed geometry, signal filtering.
- Decision logic: threshold + hold time + hysteresis to prevent rapid switching.
pH (context metric)
pH provides context about water chemistry and is displayed as an informational metric. Irrigation water pH can influence nutrient availability and scaling risk, but pH alone does not quantify clarity or many specific contaminants. We therefore use turbidity as the control variable and pH as a diagnostic consistency check.
Flow, mixing, and contact time
Pump flow rate affects pressure drop across the filter and contact time in the carbon stage. Higher flow shortens cycle time but reduces per-pass contact time; lower flow improves adsorption but reduces throughput. As the filter loads, resistance increases and performance can shift over time. The advantage of the sensor-gated semi-batch approach is adaptability: it runs longer when required rather than assuming worst-case conditions at all times.
4) General Materials and Parts List (Expanded)
Turbidity Sensing (Phototransistor)
- Arduino UNO R3 (or equivalent MCU)
- 5 V USB power supply
- LED source (IR or visible)
- Phototransistor
- LED current-limiting resistor
- Resistor/load for phototransistor sensing (to create readable voltage)
- Breadboard + jumper wires
- Opaque housing / black heat-shrink tubing
Phototransistor output is read as an analog voltage correlated with transmitted light intensity. Light shielding reduces noise from room lighting and reflections.
pH Sensing (context metric)
- Arduino UNO R3
- pH sensor module
- Display screen
- (Optional instrumentation components for stability if using raw probe conditioning)
pH is measured after treatment as a chemistry indicator and consistency check; it is not the main pass/fail trigger.
Filtration and Adsorbent Module
- Activated carbon
- Micron-scale nylon mesh / filter pad (target ~150 µm for emitter protection)
Mesh removes suspended solids by size exclusion and interception. Activated carbon adsorbs dissolved organic compounds and adds treatment margin. Flow rate and packing density affect pressure drop and contact time and will be optimized during testing.
Valve and Flow Routing (Adaptive Control)
- 2 × micro servo motors
- 2 × pinch valve housings (3D printed) + mounting hardware
- External 5–6 V power supply for servos
- Common ground wiring between Arduino and servo supply
Servos actuate pinch valves to redirect flow without contacting water. External servo supply prevents voltage drops and unintended MCU resets.
Pump, Tubing, and Fluid Handling
- Pump
- Flexible tubing
- Barbed hose fittings
- Hose clamps or zip ties
- Silicone sealant
- Reservoir containers (prototyping tanks/cups)
Water Level Sensing (Semi-batch operation)
- Ultrasonic distance sensor (or float switch)
- Arduino UNO R3
Tools / Fabrication
- Soldering iron
- Wire cutter / stripper
- Multimeter
- Glue gun / electrical tape
- 3D printer (e.g., Bambu Lab P1S)
5) Market Research
Market nature (size / trend / fragmentation)
| Item | Content | Source |
|---|---|---|
| Market size | Global drip irrigation market ≈ $6B (2024) | Stellar Market Research — Drip Irrigation Systems Market |
| Trend / CAGR | Projected ~10–12% CAGR through ~2030 | Stellar Market Research — Drip Irrigation Systems Market |
| Fragmentation | Fragmented across filtration tech (screen/sand/disk) plus chemical treatment add-ons | DripWorks — Types of Irrigation Filters |
SWOT Analysis
| Strength | Weakness | Opportunity | Threat |
|---|---|---|---|
| Adaptive filtration reduces emitter clogging; real-time water quality monitoring; potentially lower maintenance vs static filters | Requires electrical power; sensor calibration required; added hardware complexity | Precision agriculture growth; smart farm automation trends; water scarcity policy pressure | Established irrigation OEMs; conservative adoption by farmers; certification/compliance requirements |
Competitor Analysis / Comparable Offerings
| Product / Category | Example vendor | Notes (Why it matters) |
|---|---|---|
| Screen filters | Netafim | Fixed filtration level; not turbidity-adaptive; can clog under sediment spikes |
| Sand media filters | Amiad (example category) | Effective for organics but typically higher maintenance/backwash requirements |
| Disk filters | Rain Bird | Widely used; performance depends on disk grade and cleaning schedule |
| Chemical injection | Industry standard add-on | Helps biofouling/scale; does not replace solids filtration and adds operating cost |
Cost Breakdown (Prototype BOM)
| Category | Estimated Cost | Notes |
|---|---|---|
| Electronics (MCU + sensors + display) | ~$55.50 | Arduino ($20) + pH module ($24) + screen ($10) + turbidity components (~$1.50) |
| Media / filter (mesh + activated carbon) | ~$45.00 | ~$13 mesh + ~$32 carbon |
| Pump / valves / plumbing | ~$36.50 | ~$25 pump + ~$8 servos + ~$3.50 tubing/fittings |
| Fabrication (3D-printed parts) | ~$5.00 | PLA + hardware |
| Estimated prototype total | ~$149 | Prototype estimate; updated as purchases are made |
Value Proposition / Market Opportunity
- Adaptive filtration: filters only as long as needed using real-time turbidity feedback (avoids permanent over-filtration).
- Reliability: reduces emitter clogging, downtime, and maintenance burden under variable sediment conditions.
- Efficiency: semi-batch design minimizes energy by stopping when clarity target is met.
- Positioning: complements existing filtration approaches by adding sensing + control to respond to turbidity spikes automatically.
Target Market, Pricing, and Marketing Strategy
- Target users: growers using drip/micro irrigation with surface water or mixed sources; operators impacted by turbidity variability.
- Geography: regions with water scarcity, surface-water reliance, and increasing precision agriculture adoption.
- Pricing (prototype context): early prototype built from commodity components; future pricing depends on enclosure, durability, and scaling.
- Go-to-market concept: sell through irrigation suppliers / farm equipment channels; emphasize reduced clogging and reduced maintenance vs fixed filtration.
6) Timeline + Project Management (Gantt + Milestones)
Milestone Summary
| Milestone | Due Date | Points | Status |
|---|---|---|---|
| Preliminary Design Report | Week 2 | 100 pts (10%) | ✅ Complete |
| Initial Design Presentation | Week 4 | 100 pts (10%) | 🔄 In Progress |
| Demo 1: Initial Prototype | Week 7 | 125 pts (12.5%) | ⏳ Planned |
| Demo 2: Intermediate Prototype | Week 10 | 125 pts (12.5%) | ⏳ Planned |
| Demo 3: MVP | Week 13 | 150 pts (15%) | ⏳ Planned |
| Final Report | Week 17 | 225 pts (22.5%) | ⏳ Planned |
| Final Demonstration | Week 17 | 125 pts (12.5%) | ⏳ Planned |
| Total | 1000 pts |
Gantt Chart (Semester Plan — update weekly)
Update this chart throughout the semester with real-time progress. Mark completed tasks, add notes/links to test results, and refine durations as needed.
| Task | W1 | W2 | W3 | W4 | W5 | W6 | W7 | W8 | W9 | W10 | W11 | W12 | W13 | W14 | W15 | W16 | W17 |
|---|---|---|---|---|---|---|---|---|---|---|---|---|---|---|---|---|---|
| Preliminary Design (report + block diagram) | |||||||||||||||||
| Initial Design (market research + SWOT + slides) | |||||||||||||||||
| Component testing (sensor + mesh + pump) | |||||||||||||||||
| Demo 1 build + proof of concept | |||||||||||||||||
| Demo 2 integration (valves + control + logging) | |||||||||||||||||
| Demo 3 enclosure + robustness | |||||||||||||||||
| Final report + final demo prep |
Legend: Done Active Planned
7) Future Considerations
Expanded Water Quality Sensing
Currently, turbidity is the primary control variable and pH is a diagnostic/context readout. Future versions could incorporate conductivity/TDS to quantify dissolved ions that remain invisible to turbidity sensing and improve confidence in water quality under varying source conditions.
Data Logging and User Interface Improvements
Future iterations could include data logging via SD card or wireless communication to record turbidity, pH, and cycle duration over time. This would help track performance, identify trends, and give clearer guidance on maintenance and media replacement.
Scalability and Cartridge-Based Design
The filtration media could be redesigned as replaceable cartridges for easier maintenance and scalability. Media swaps (e.g., catalytic carbon, alternative adsorbents) could tailor treatment to specific irrigation source-water challenges.
Integrated and Enclosed System Design
A future enclosure could protect sensors/electronics from the environment, reduce contamination risk, and improve robustness for real farm settings.
References
U.S. Geological Survey (USGS). “Turbidity and Water.” Available at: https://www.usgs.gov/water-science-school/science/turbidity-and-water
California State Water Resources Control Board. “Guidance for Continuous Water Quality Monitoring.” Available at: https://www.waterboards.ca.gov/water_issues/programs/swamp/docs/cwt/guidance/3150en.pdf
International Water Association Publishing. “Setting Water Quality Criteria for Agricultural Water Reuse.” Available at: https://iwaponline.com/jwrd/article/7/2/121/28751/Setting-water-quality-criteria-for-agricultural
United States Department of Agriculture (USDA), National Agricultural Statistics Service (NASS). “Irrigation and Water Management Survey News Release (2024).” Available at: https://www.nass.usda.gov/Newsroom/archive/2024/10-31-2024.php
Stellar Market Research. “Drip Irrigation Systems Market Report.” Available at: https://www.stellarmr.com/report/Drip-Irrigation-Systems-Market/1397
DripWorks. “What Are the Different Types of Filters for Your Irrigation System?” Available at: https://www.dripworks.com/blog/what-are-the-different-types-of-filters-for-your-irrigation-system
Netafim. “Agricultural Filtration Systems Documentation.” Available at: https://www.netafim.com
Rain Bird Corporation. “Agricultural Irrigation Filtration Manuals.” Available at: https://www.rainbird.com
McCabe, W. L., Smith, J. C., and Harriott, P. Unit Operations of Chemical Engineering. McGraw-Hill Education.
Perry, R. H., and Green, D. W., editors. Perry’s Chemical Engineers’ Handbook. McGraw-Hill Education.
Centers for Disease Control and Prevention (CDC). “Drinking Water Facts and Statistics.” Available at: https://www.cdc.gov/drinking-water/data-research/facts-stats/index.html
Culligan of Houston. “Problems with pH in Drinking Water.” Available at: https://houstonculligan.com/problems/ph-problems/
Arduino Forum. “pH Sensor Detection Circuit Design.” Available at: https://forum.arduino.cc/t/ph-sensor-detection-circuit-design/478631